Expertise
Data Analysis
Expertise in data cleaning, exploratory data analysis, feature engineering, statistical analysis, and machine learning model optimization using Python libraries such as Pandas, NumPy, Matplotlib and Seaborn. Proficient in creating interactive dashboards using Microsoft Power BI, Tableu, SQL, and Excel to transform complex datasets into actionable insights.
AI/ML Solution Development
Hands-on experience in developing, training, and deploying scalable and real-time AI/ML solutions, including supervised and unsupervised learning algorithms.
Projects
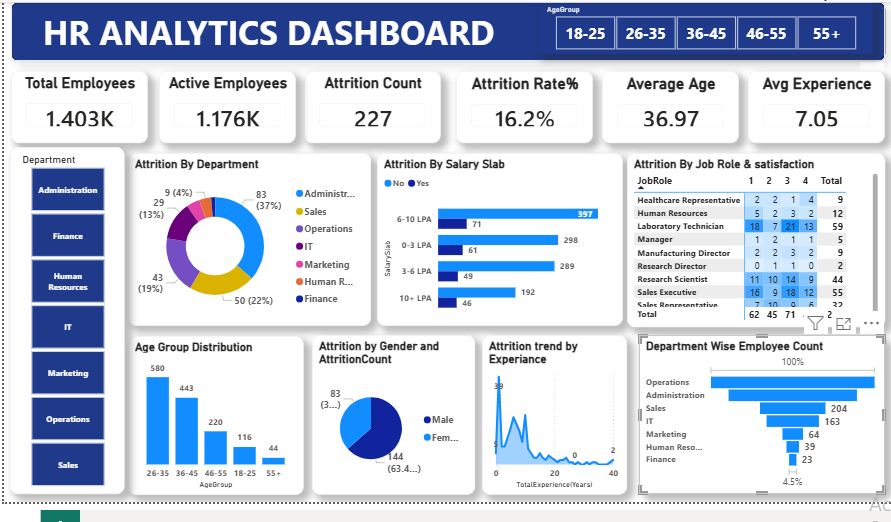
HR Analytics Dashboard | Power BI.
Designed and built a professional HR Analytics Dashboard in Microsoft Power BI to support HR decision-making through data-driven insights. The project involved data preprocessing with Power Query, KPI development using DAX, and the creation of interactive dashboards analyzing employee attrition, workforce distribution, experience trends, salary slabs, and job satisfaction. The dashboard enables dynamic filtering and clear visualization of key HR metrics for effective business analysis.
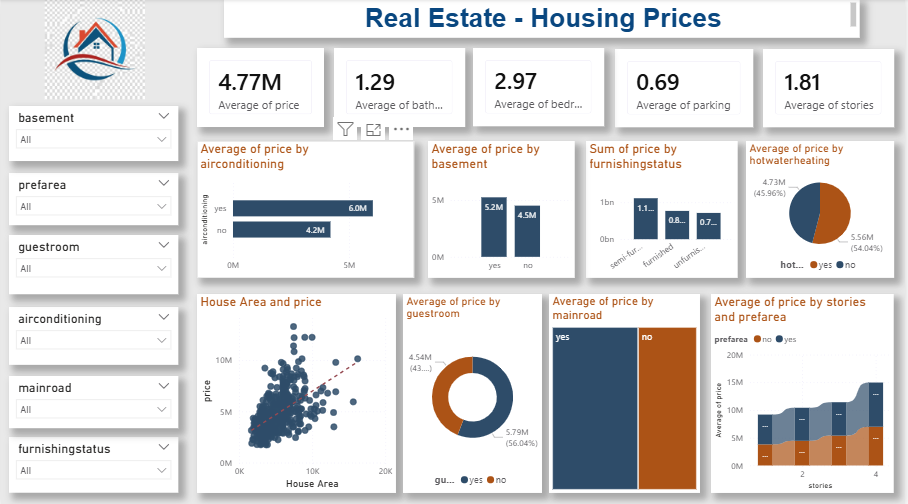
House Price Prediction | Power Bi.
Designed and built an interactive Real Estate Housing Prices Dashboard using Microsoft Power BI to analyze housing price trends and property features through data-driven insights. The project involved data cleaning and transformation using Power Query, KPI creation with DAX, and the development of interactive visualizations analyzing house prices based on area, furnishing status, air conditioning, parking, basement availability, and other property attributes. The dashboard enables dynamic filtering and clear visualization of real estate insights for effective business analysis.
Shopping Trendy Dashboard | Power Bi.
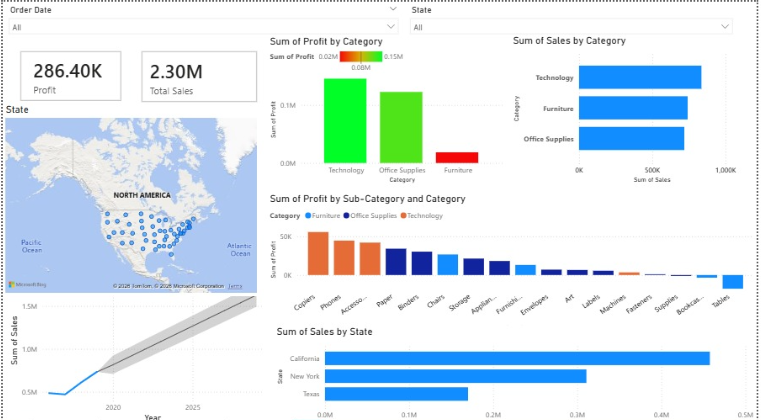
The dashboard provides a comprehensive overview of key business metrics, including Total Sales, Total Profit, yearly sales trends, and state-wise sales distribution. It enables users to monitor performance, compare category profitability, and identify high-performing products and regions. By visualizing sales and profit data through dynamic charts, maps, and filters, stakeholders can better understand customer purchasing patterns, evaluate regional performance, and make more data-driven business decisions.
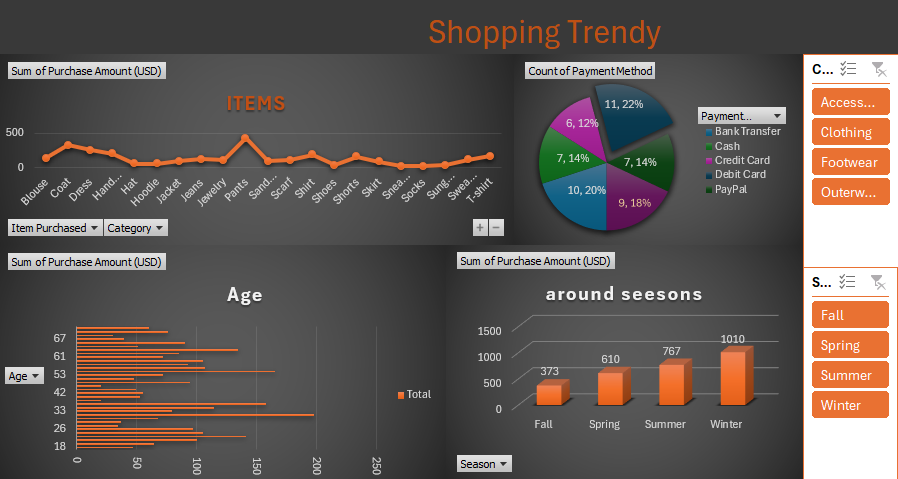
Shopping Trendy Dashboard | Excel.
Created an interactive sales dashboard in Excel using a large dataset that involved data cleaning, building Pivot Tables, and creating charts. The dashboard provides analyze shopping sales performance across product categories, seasons, and customer demographics using a large dataset.
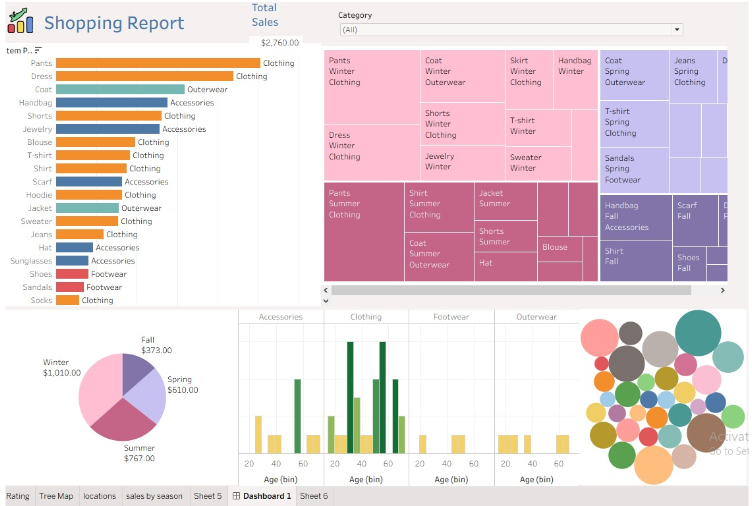
Shopping Sales Analysis Dashboard | Tableau.
Developed an interactive Tableau dashboard to analyze shopping sales performance across product categories, seasons, and customer demographics using a large dataset. The dashboard provides insights into top-selling products, seasonal trends, customer age distribution, and category performance to support data-driven business decisions.
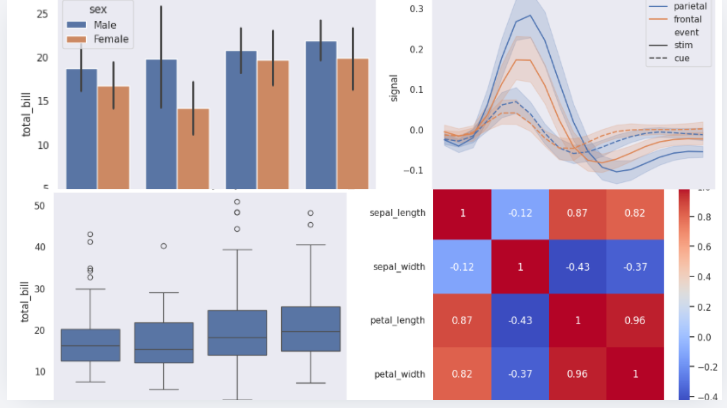
Python Data Analysis & Visualization using Seaborn
Performed exploratory data analysis and statistical visualization using Python library Seaborn. Created multiple visualizations such as correlation heatmaps, distribution plots, boxplots, and categorical analysis charts to identify trends, feature relationships, and data patterns. Used to understand relationships between variables and Helpful for detecting patterns and outliers Visualizations created using built-in datasets Seaborn for practice and demonstration of Python visualization skills.
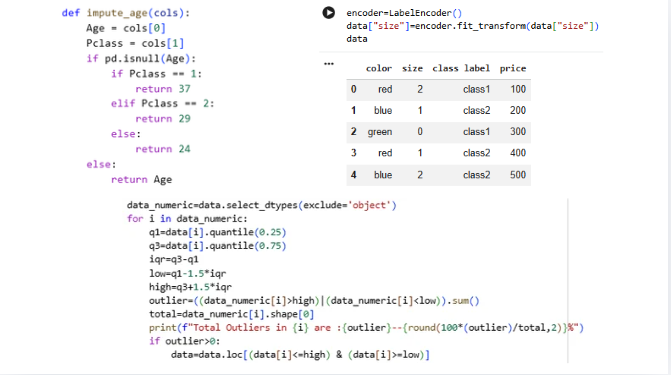
Data Preprocessing Techniques
1\\Missing Value Handling Applied conditional imputation to replace missing values in the Age column using the average age of each passenger class (Pclass) instead of using a global mean. This method improves data quality by considering the relationship between passenger class and age, resulting in more accurate and context-aware preprocessing. 2//Categorical Encoding Used LabelEncoder from Scikit-learn to transform categorical features into numerical values, enabling machine learning models to process non-numeric data efficiently while preserving category distinctions. 3//Outlier Detection & Removal Implemented the Interquartile Range (IQR) technique to detect and remove outliers from numerical features. This method identifies extreme values based on data distribution and helps improve model performance, reduce noise, and enhance statistical reliability without heavily affecting normal observations.
Timeline
Bachelor’s degree in Computer Science, Major: Artificial Intelligence, Faculty of Computers and Artificial Intelligence, 6th October University.
National Telecommunication Institute (NTI) completed training in Machine Learning and Data Science.
Instant Software Solutions – Completed 120 hours. Focused on Python programming, Data Science, Data Analysis, Machine Learning, Deep Learning, and Natural Language Processing (NLP).