Expertise
Data Analysis & Visualization
Expertise in extracting, cleaning, and transforming data, performing exploratory data analysis, and creating insightful visualizations to drive business decisions.
Business Intelligence Development
Skilled in designing and developing interactive dashboards and reports using leading BI tools to translate complex data into operational insights and track key performance indicators.
Machine Learning & Predictive Analytics
Experience in applying machine learning models for predictive analysis, including attrition prediction and sentiment analysis, to uncover trends and support strategic planning.
Data Engineering & Scraping
Proficient in building end-to-end data pipelines, including web scraping custom datasets and preprocessing raw data for analytical readiness.
Projects
AI-Powered HR Analysis Platform
Provides predictive insights for HR, including attrition, performance, and pay equity analysis.Predictive Modeling: Developed an end-to-end Python platform using Scikit-learn, deploying a Random Forest Regressor for performance forecasting and a Gradient Boosting Classifier (with SMOTE) to predict promotion readiness. o Explainable AI (XAI) & Diagnostics: Implemented SHAP values with Logistic Regression to uncover core behavioral drivers of employee attrition, and applied Linear Regression to detect pay equity disparities. o Prescriptive Analytics: Built an automated recommendation engine that translates complex predictive outputs into actionable HR policies, enabling data-driven retention and talent development strategies.
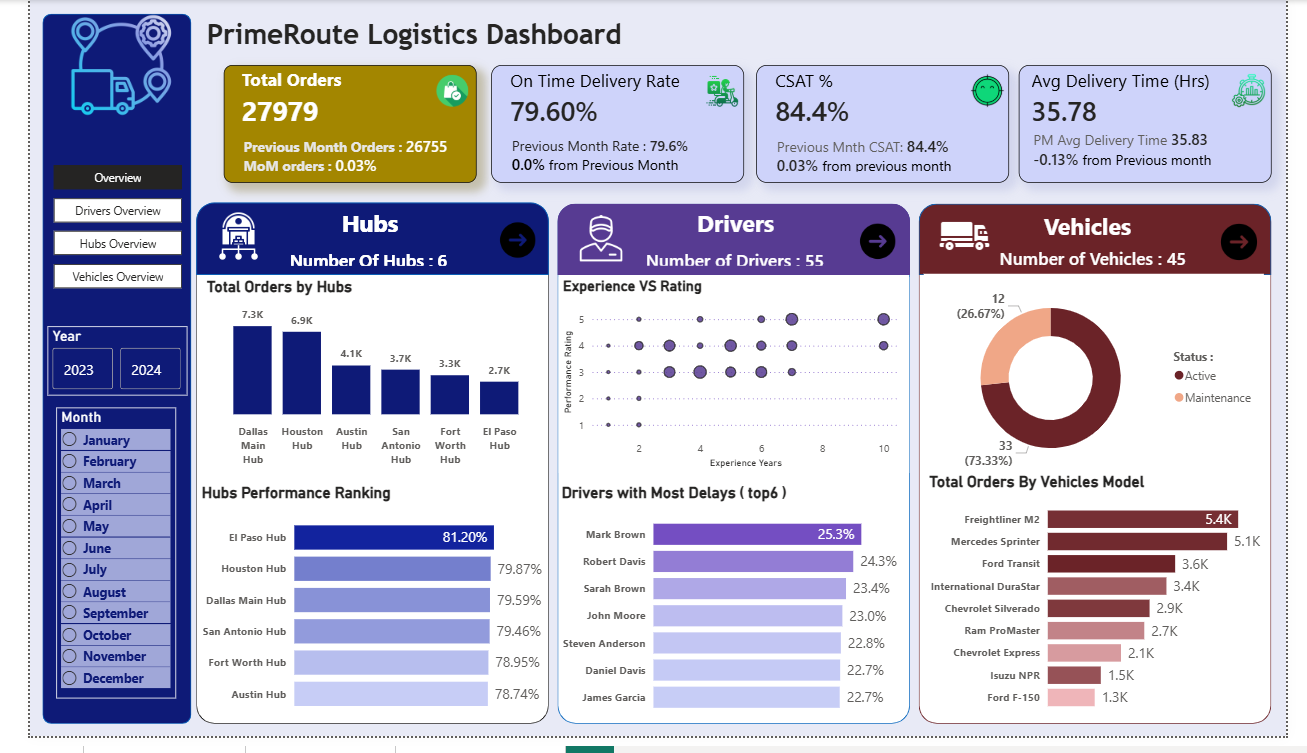
PrimeRoute Logistics: Performance Dashboard
Visualized critical KPIs like On-Time Delivery (79.6%) and CSAT (84.4%) to drive preventive maintenance.Developed a Power BI dashboard to transform complex logistics data into operational insights, designing an optimized Star Schema and authoring complex DAX for performance correlations.
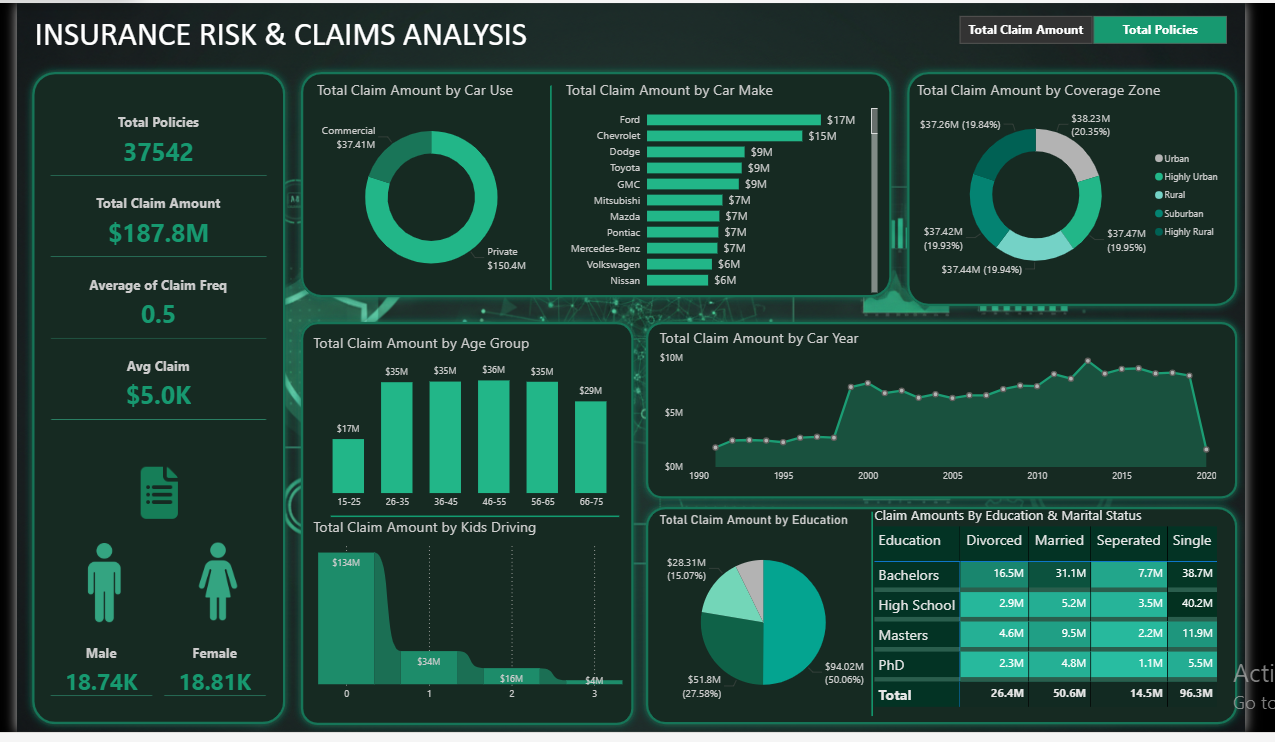
Insurance Risk & Claims Analysis Dashboard
An insurance company needed a centralized interactive dashboard to better understand its policyholder base and claim patternshe objective was to build a Power BI dashboard that provides: Clear KPI tracking Risk segmentation Demographic and behavioral analysis Interactive dynamic reporting 📊 KPI Metrics The dashboard includes the following key performance indicators: Total Policies – Measures the size of the customer base Total Claim Amount – Overall financial exposure Claim Frequency – Indicates how often claims occur Average Claim Amount – Measures claim severity Gender-wise Policy Distribution – Customer segmentation

Timeline
Expected Bachelor of Computer and Information Sciences, Information Systems from Ain Shams University.
Served as a Data Analyst Intern at CodeAlpha, executing end-to-end data pipelines and applying NLP for sentiment analysis.
Completed the 120-hour Business Intelligence Development Trainee program at ITI.
Earned the Associate Data Analyst in SQL certification from Datacamp.